We now at the end of the journey of this series with a lot of amazing tools that we’ve get used to.Now we’ll discover another 2 amazing tools which help us to manage and monitoring our k8s cluster. It’s lens and Open Observe.
Table contents
- Part 1: My first time deploy a web to a aws cloud service
- Part 2: Docker and containerization
- Part 3: K8s and the new world of container orchestration
- Part 4: Deploy your express application to k8s
- Part 5: Networking with K8s is f***ing hard
- Part 6: From the cloud to ground: Physical server setup for a private cloud
- Part 7: From the cloud to ground: Install Ubuntu Server and Microk8s
- Part 8: From the cloud to ground: Harvester HCI for real world projects
- Part 9: From the cloud to ground: Private images registry for our private cloud
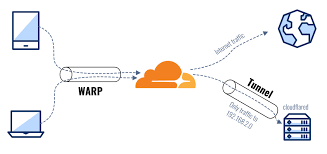
- Part 10: From the cloud to ground: Accept outside world traffics via Cloudflare tunnel
- Part 11: From the cloud to ground: CI/CD with git hub runners
- Part 12: Monitoring and debugging with Open Observe and lens
Lens
Lens is a k8s dashboard which allow you to monitoring and manage your k8s cluster with nice simple UI. Install lens: https://docs.k8slens.dev/getting-started/install-lens/
Then lens can use your local ~/kube/config file to connect to your cluster or you can add a cluster by yourself by pasting the cluster configuration yaml file. After these steps, you can have a nice UI dashboard like this
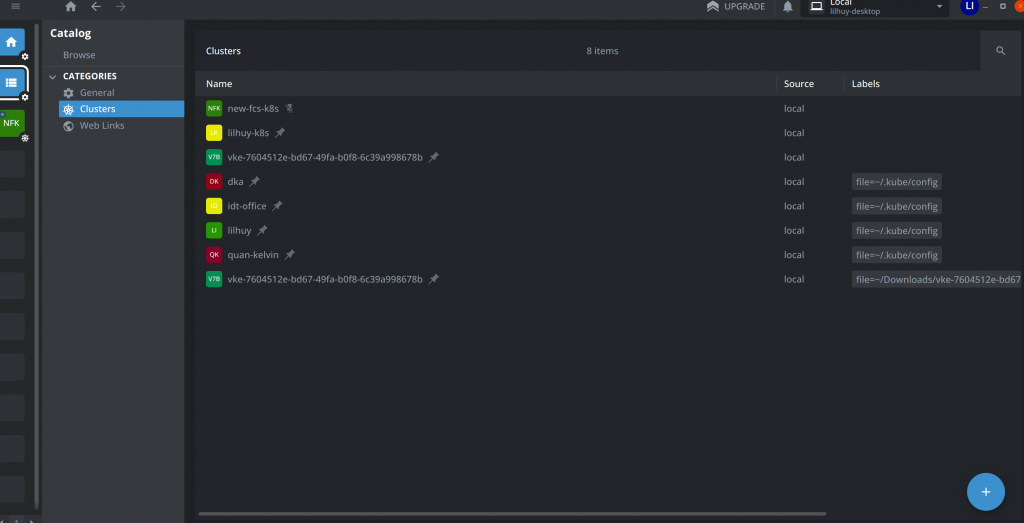
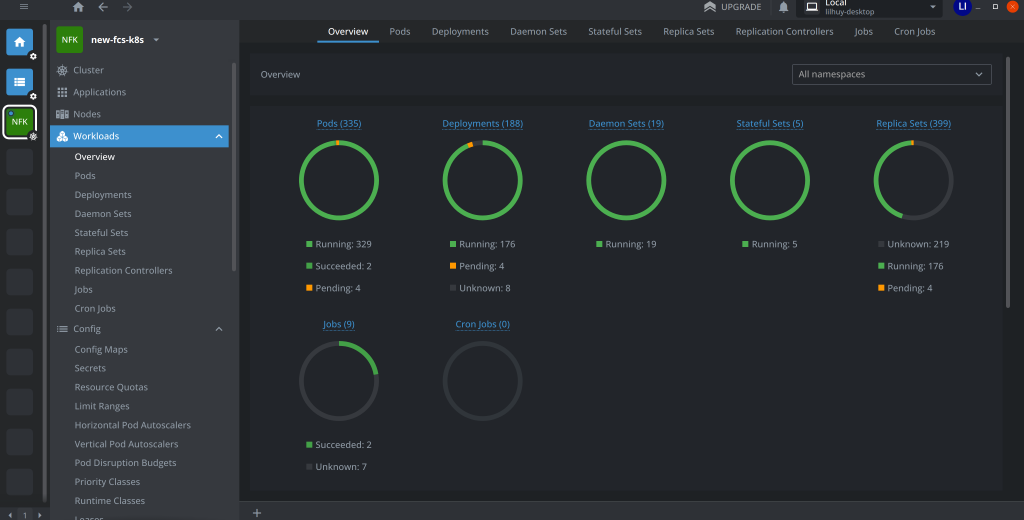
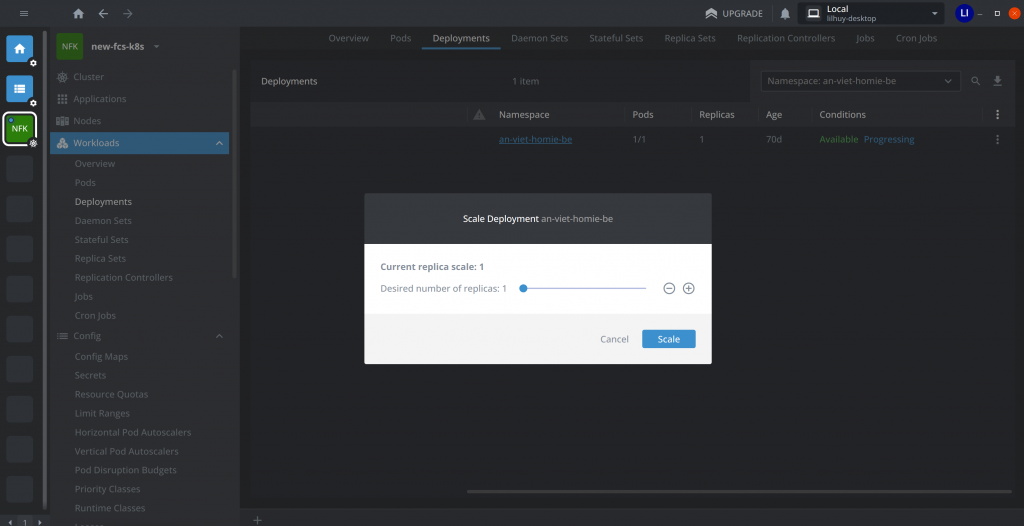
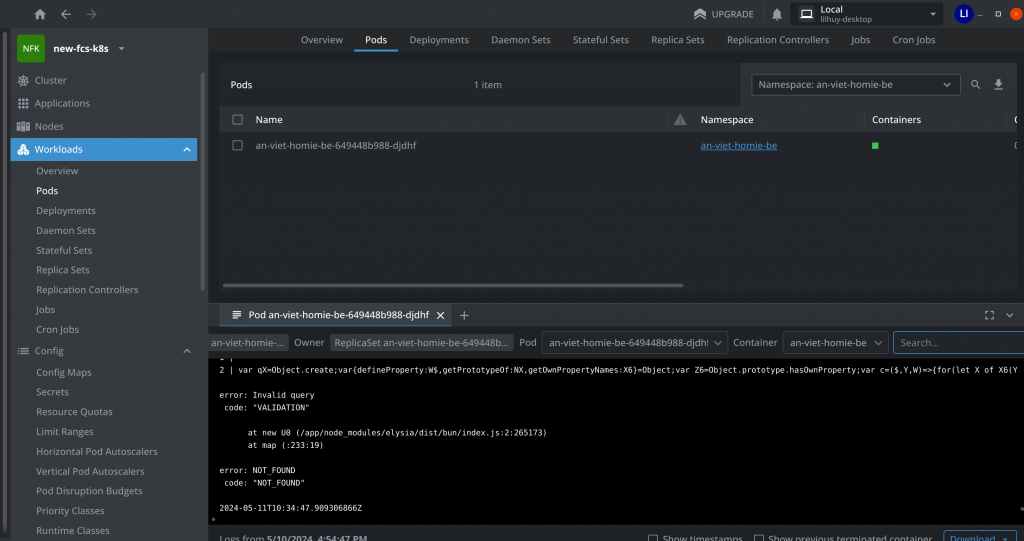
Using lens you can manage your deployment by scale it check the pod logs, check the service etc… instead of doing all theses task by tying very lots of kubectl command lens provide a nice UI for you.
Open Observe
The Open Observe Platform is an open-source observability framework designed to collect, analyze, and visualize telemetry data across various systems and applications. It provides tools for monitoring performance metrics, logs, and traces, helping developers optimize and troubleshoot their software environments.
To install open observe you can go to github release to get the binary file: https://github.com/openobserve/openobserve/releases. Or install by docker: https://gallery.ecr.aws/zinclabs/openobserve. To get an open observe up and running we need to set these 2 env variable. For more env variable refer here: https://openobserve.ai/docs/environment-variables/
export ZO_ROOT_USER_EMAIL=login-email
export ZO_ROOT_USER_PASSWORD=login-pwd
Here is the sh file so i can run the oo binary as a servive using pm2
export ZO_ROOT_USER_EMAIL=email && export ZO_ROOT_USER_PASSWORD=pwd && ./openobserve
After that your open observe dashboard will run at port 5080.
A tips: You should install the oo on a machine that not running in the k8s cluster. It make sens that a monitor don’t live inside the things that it is monitoring :)))
Now we need to stream pod logs to our open observe. The open observe blog have a blog using fluent bit to stream all pod logs to our oo: https://openobserve.ai/blog/how-to-send-kubernetes-logs-using-fluent-bit. it use helm so here is quick step to install helm (a package manager for your k8s cluster)
$ curl -fsSL -o get_helm.sh https://raw.githubusercontent.com/helm/helm/main/scripts/get-helm-3
$ chmod 700 get_helm.sh
$ ./get_helm.sh
That blog will show you how to install fluentbit to your cluster (which install a deamon set: install a pod in each node in our cluster then that node will stream all pods logs to oo). Here is quick cap:
helm repo add fluent https://fluent.github.io/helm-charts
helm repo update
helm upgrade --install fluent-bit fluent/fluent-bit --namespace fluent-bit --create-namespace
get the default fluentbit config file
kubectl -n fluent-bit get configmap fluent-bit -o yaml > fluent-bit.yaml
Update the [Output] section with the provided fluentbit output that we find in our open observe. Then apply and restart the pods
kubectl apply -f fluent-bit.yaml
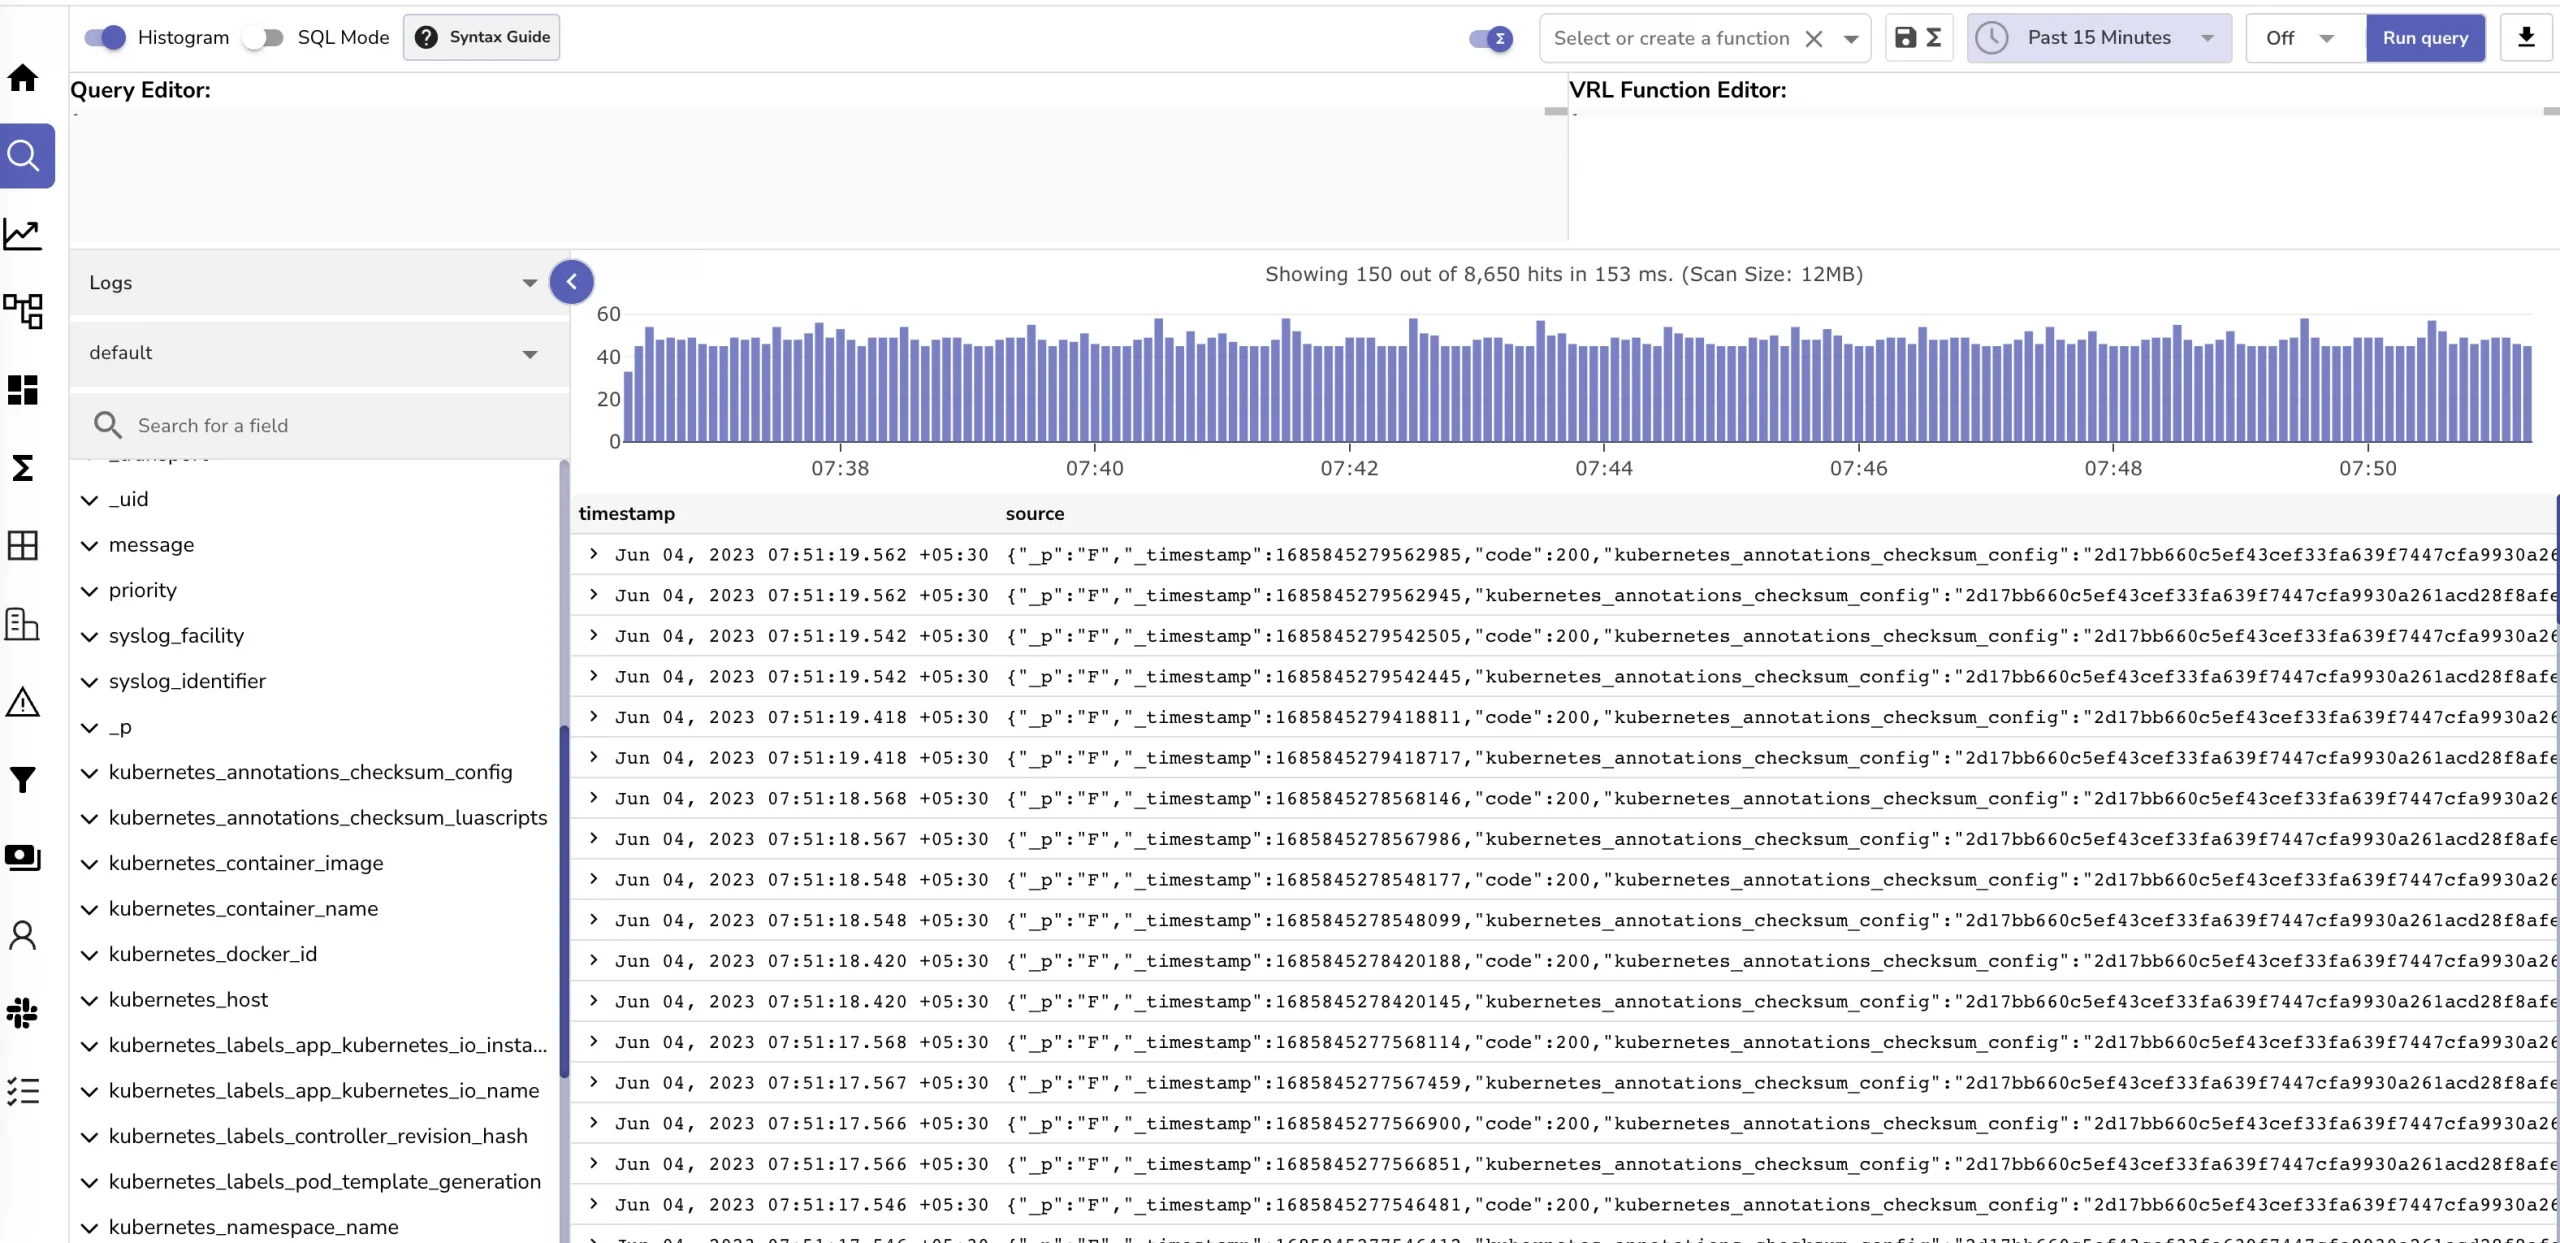
kubectl delete pods -n fluent-bit -l app.kubernetes.io/name=fluent-bitThen logs will be stream to the “default” stream of our oo
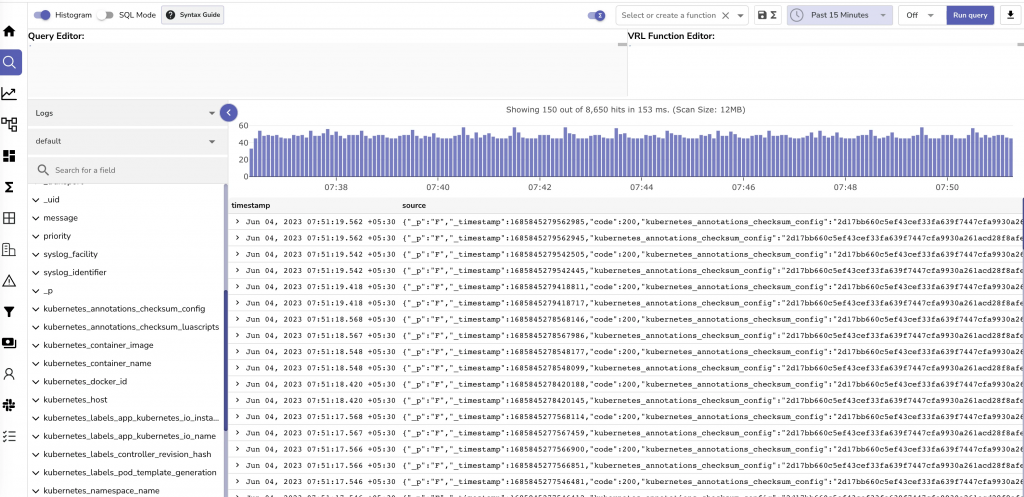
In this stream you can find the ingress nginx logs whichh will show all request to web services run in your cluster along with HTTP status code, time the request take,…
Open observe has a lot more feature i think i will write another blog out of this series for this tools. At this point i have not mastered this tool yet so see you guys soon when i can do much more thing with oo.
Conclusion
With lens and the open observe now you can manage and monitoring your cluster which help a lot to debug when your k8s cluster have a problem
Epilogue
At this point my devops story has been ended and I’m back to a noob JS full stack developer :))))).I can’t even believe I was able to finish this series. If you following the series to this point i just want to say thank you very much and sorry for my bad english and a lot of typos :)))
All tools and solutions in this series is experiences i think it is not a best practice but i think it would be the cheapest :))) Devops world have a lot more tool, concept to solve a lot more problem. Devops world is creating problems to solve problems :))))))))))))).
Hosting and deploying your own services using your own physical machines at this point is not hard as we think with helps of powerful tools that we learn a long in this series. Leave comment to correct me if I’m wrong at some points
Thanks again <3 and happy with your kubectl :v

_CoddingCat_