


F-Test
This is the case study about f-test, f-statistic application.
Question:
Prices of three brand fashion: Snapzi, Irisa and LoloMoons is “similar” or not?
We have the null hypothesis :

Note. So, null hypothesis in one-way ANOVA or f-statistic usually is “all of them is similar”. And alternative hypothesis would be that at least 2 “guy” different.
This data is collected:
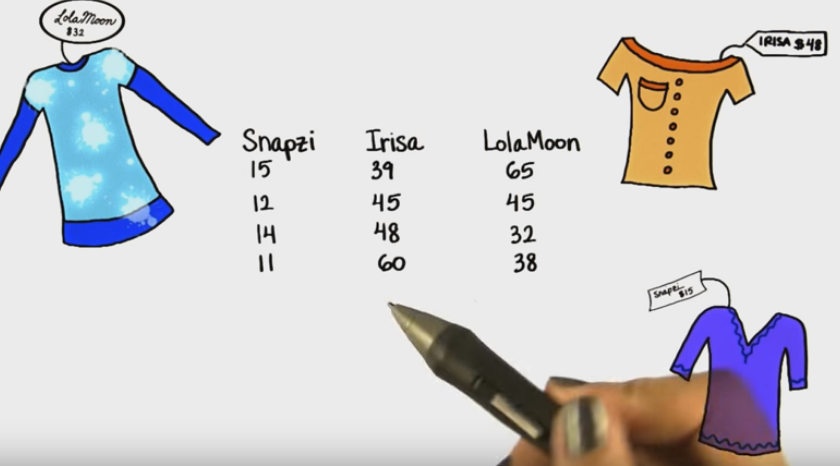
As the previous article we can fully use the t-test to answer questions. However the downside of the t-test is the only test for 2 groups, with the largest group of t-test was performed will be great, it will be by shaving of convolution of N 2 groups. So in this case we’ll use the f-test.
Step 1 : Calculate the average price of each group, calculated the average price of the entire data, which calculated based on a formula SSbetween below.

SSbetween also called Between-Group variables Between-Group Variability or Variance of the group means or Sum of square Between-Group.
Step 2: Calculate SSwithin based on fomular:

Step 3: Calculate Degrees of freedom:
With dfbetween equal total of groups – 1 = 3 – 1 = 2
With dfwithin equal total of sample – total of groups = 12 – 3 = 9

Step 4 : Calculate Mean Squares,:
MSbetween = SSbetween / dfbetween
MSwithin = SSwithin / dfwithin

Step 5: Calculate f-statistic = MSbetween / MSwithin

To be able to conclude accept null hypothesis or not, we calculate f-statistic (with alpha = 0.05)
Find in table f-table(0.05) with dfbetween (df1) = 2 and dfwithin(df2) = 9
We have:

We have f-statistic = 4.2565
Because f-statistic > f-critical-value, we can concluded that not accept the null hypothesis. That mean is: the price of three brand fashion: Snapzi, Irisa, LoloMoon is not the same.